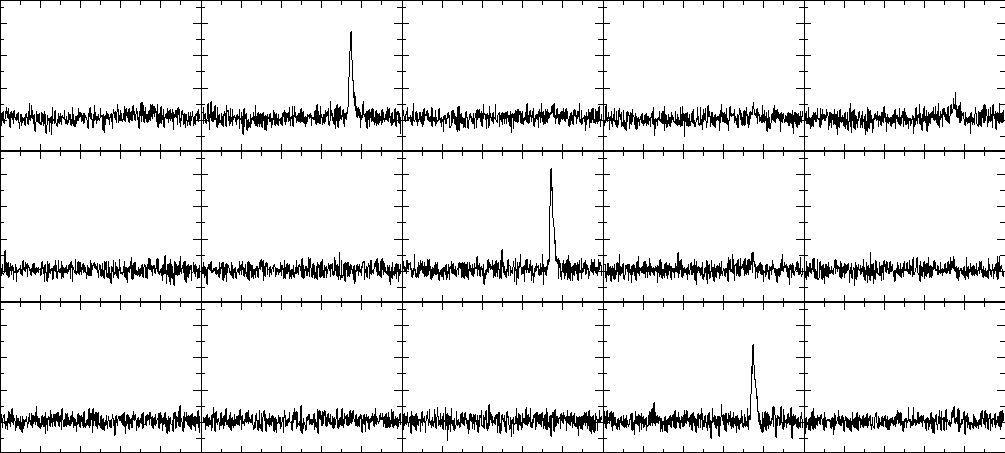
Vela in the tied array beam during our first FRB search
13 March 2015. First single beam on sky and writing to a filter bank files. 12 hours on sky at DEC=-45. This section shows individual pulses from Vela as it passes through the transit point over a period of about 8 seconds.
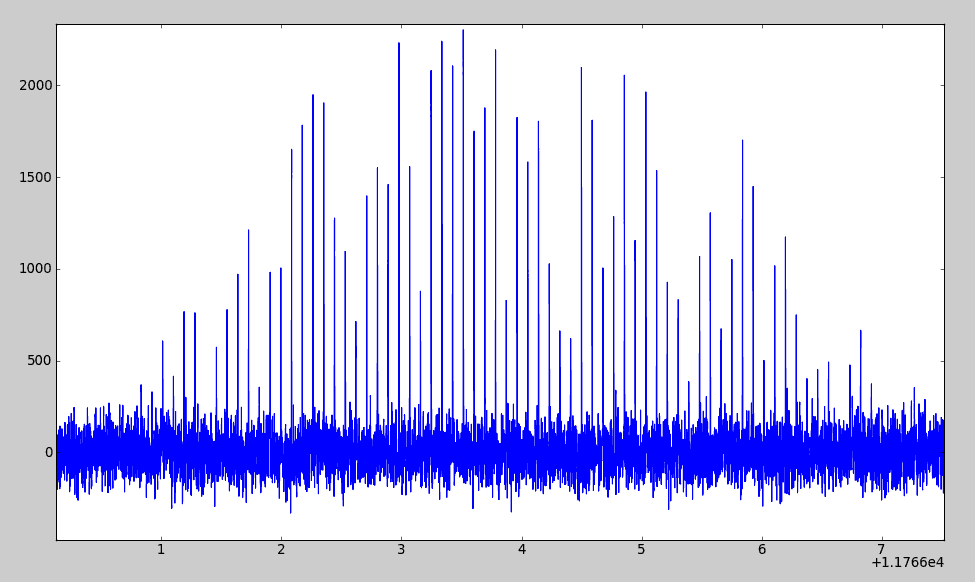
Brightest individual Vela pulse detection to date
13 Mar 15. Our brightest single Vela pulse so far – from 88 antenna tied array beam. SNR of 66!
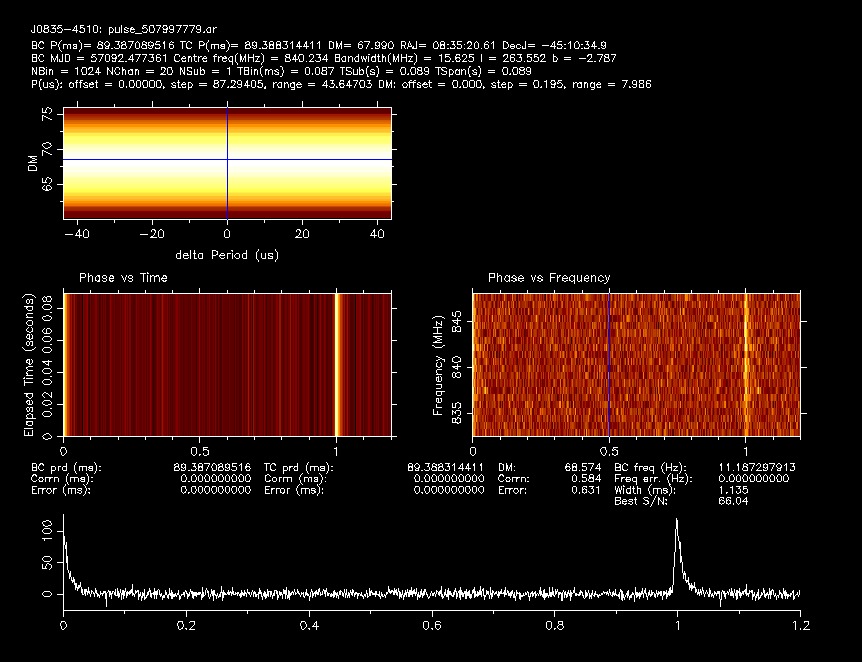
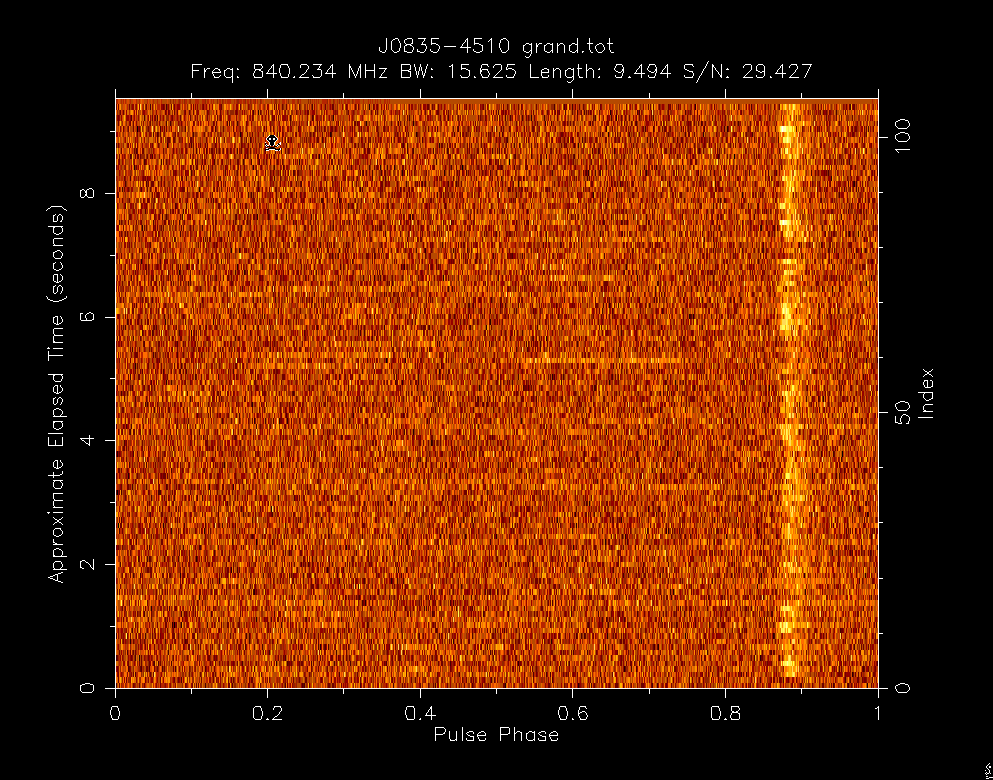
Individual pulses from Vela from baseband data
23 Jan 2015: Single pulse archive observations, for the first time live using the tied array beam. 10 seconds of data on Vela, showing about 110 individual pulses as a function of phase. The total S/N for 10 seconds was ~70, and the average S/N per pulse about ~7. Clean pulses through a lot of phone call activity show the power of the array! (MC/VR/CF)
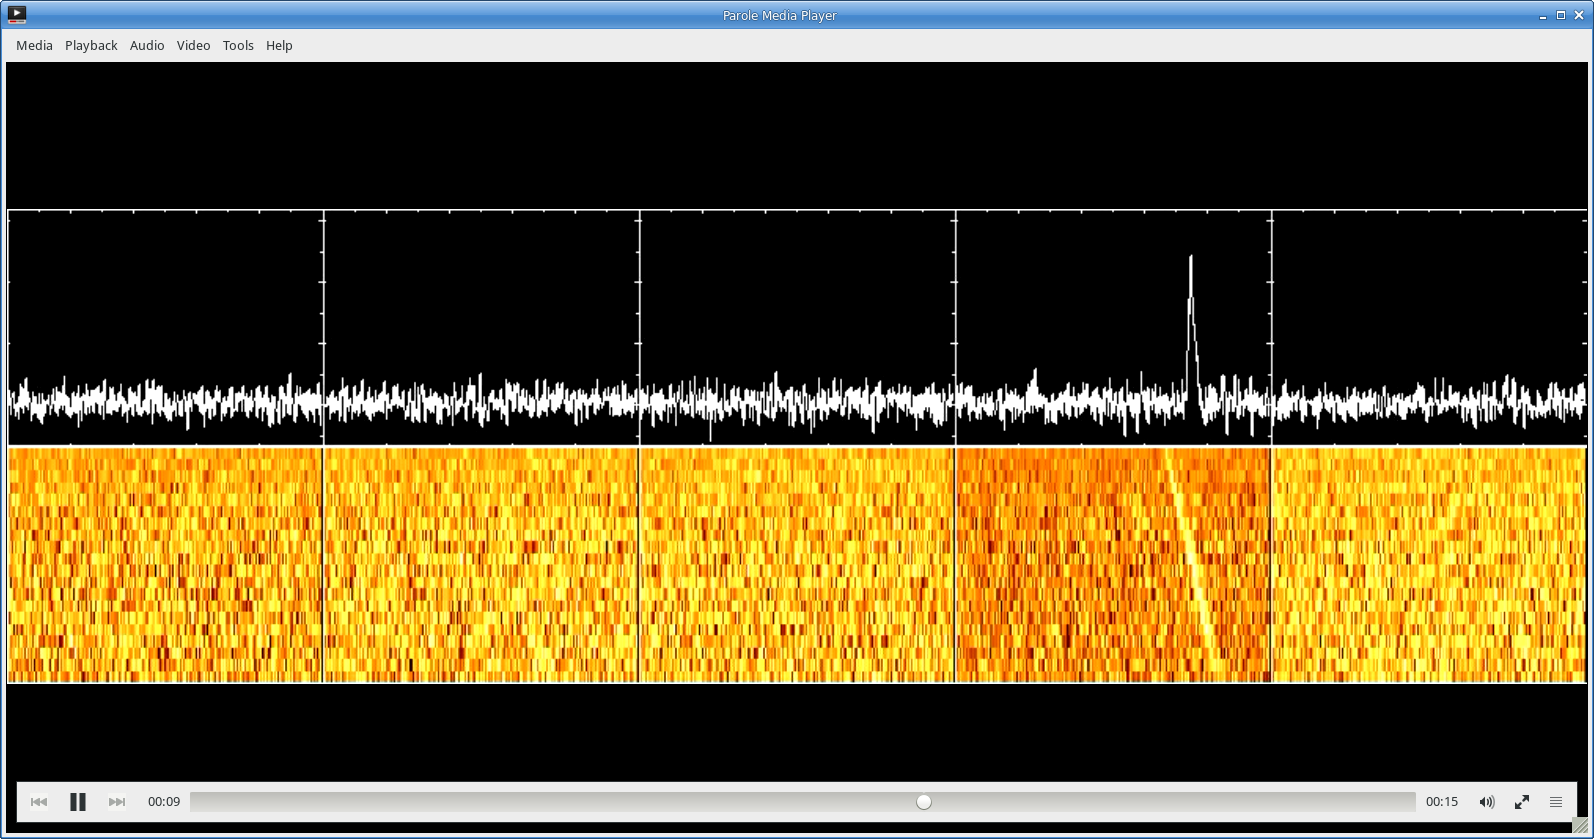
Handset spectra
Example phone calls from two handsets at once. Vodafone is the one on the left, Telstra on the right.
Pulsar transiting multiple fan beams
Pulsar crossing through the inner 3 of 5 consecutive fan beams on the sky. Credit: Andrew Jameson.
Vela transiting through 5 narrow fanbeams in the primary beam Individual pulses in the fanbeams. Link to video.
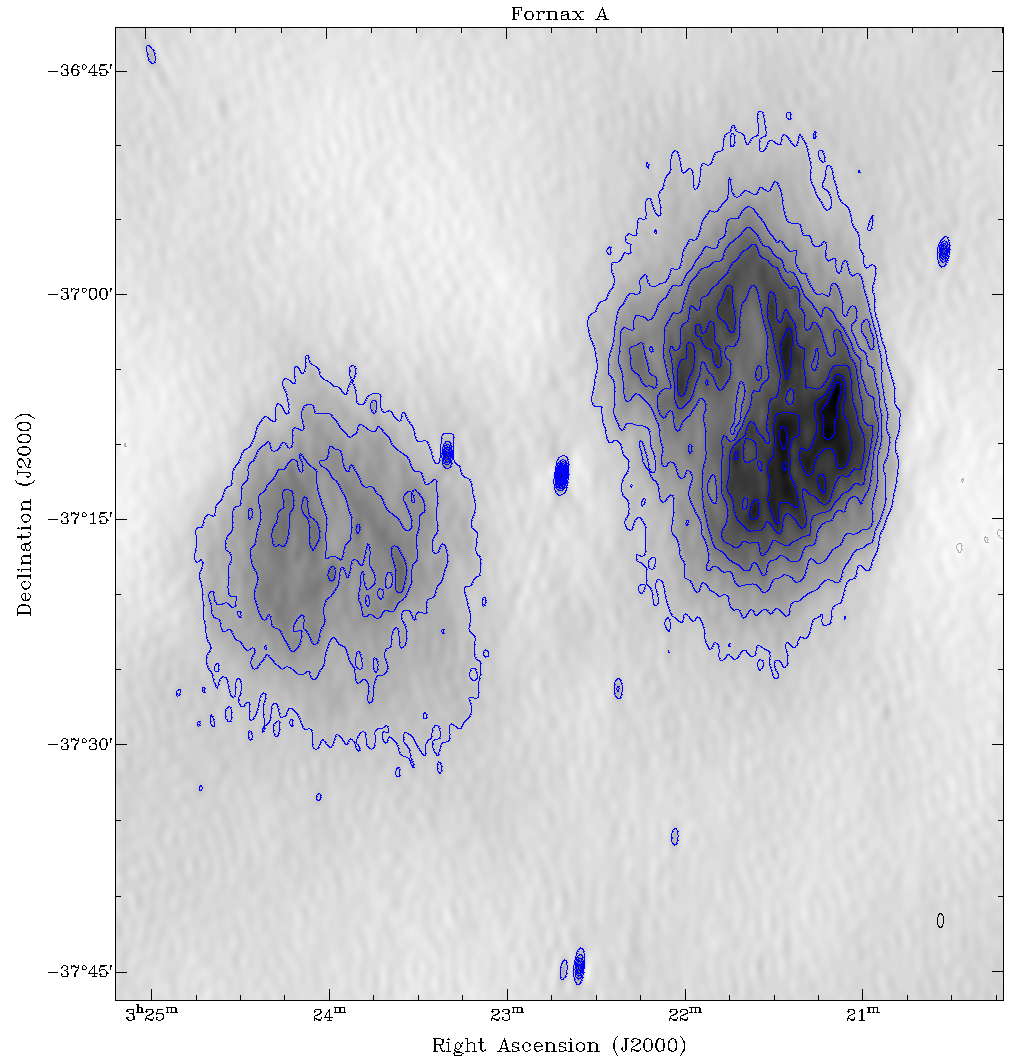
Mapping Fornax A
Fornax A: 9 hr of data, of which most was usable. We observed a nearby calibrator every two hours. Image noise ~ 5 mJy, and contour levels are at -25, 25, 50, 75 … mJy. We did the deconvolution using a combination of CLEAN with the short baselines excluded to model and subtract point sources, and MAXEN to deal with the extended structure. We weighted the visibilities to optimise the dynamic range, which (given the 25 mJy artefacts and the maximum flux density per beam of 320 mJy) comes to 12.8. The artefacts are dominated by the effects of the extended structure. Credit: Vikram Ravi, Chris Flynn, Matthew Bailes.