S2PLOT:Gallery
From S2PLOT
| Revision as of 00:11, 20 December 2007 S2plot admin (Talk | contribs) ← Previous diff |
Current revision S2plot admin (Talk | contribs) |
||
| Line 1: | Line 1: | ||
| - | The following images were created using S2PLOT. | + | The following images were created using S2PLOT. All images are copyright Swinburne University of Technology unless otherwise indicated, and should not be used without [[S2PLOT:Contact | permission]]. |
| == 6dF Galaxy Survey == | == 6dF Galaxy Survey == | ||
| + | <table> | ||
| + | <tr> | ||
| + | <td> | ||
| [[Image:S2plot_6df_sample.png]] | [[Image:S2plot_6df_sample.png]] | ||
| - | + | </td> | |
| + | <td valign=top align=left width=80%> | ||
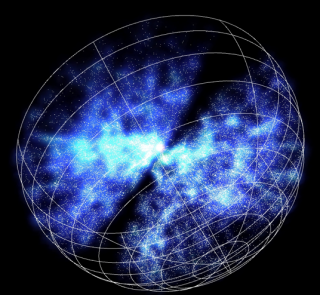
| 50,000 galaxies (v < 15,000 km/s) from the 6dF Galaxy Survey second data release (Jones et al. 2005). With S2PLOT, it is simple to create an interactive redshift-space cone diagram. | 50,000 galaxies (v < 15,000 km/s) from the 6dF Galaxy Survey second data release (Jones et al. 2005). With S2PLOT, it is simple to create an interactive redshift-space cone diagram. | ||
| + | </td> | ||
| + | </tr> | ||
| + | </table> | ||
| + | |||
| + | == Cosmological Simulation: Dark Matter Halo == | ||
| + | <table> | ||
| + | <tr> | ||
| + | <td> | ||
| + | [[Image:S2plot_cosmo_sample.png]] | ||
| + | </td> | ||
| + | <td valign=top align=left width=80%> | ||
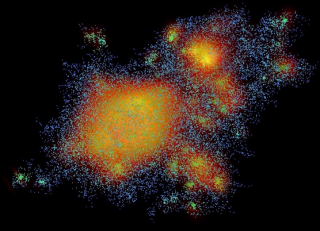
| + | In this example, the sub-halo structure in a Dark Matter halo is clearly visible. Along with coloured points for each particle, a real-time volume rendering helps to emphasise the regions of highest mass density. | ||
| + | </td> | ||
| + | </tr> | ||
| + | </table> | ||
| + | |||
| + | == Cosmological Simulation: Merger Tree == | ||
| + | <table> | ||
| + | <tr> | ||
| + | <td> | ||
| + | [[Image:S2plot_mergertree_sample.png]] | ||
| + | </td> | ||
| + | <td valign=top align=left width=80%> | ||
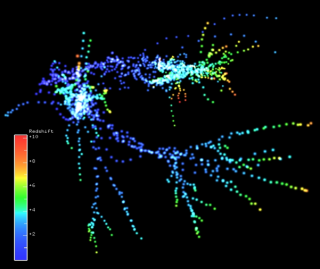
| + | A merger tree showing the assembly of a galaxy over time from the Millennium Run (Springel et al. 2005). Colour indicates the formation epochs of progenitor halos. | ||
| + | </td> | ||
| + | </tr> | ||
| + | </table> | ||
| + | |||
| + | == Instructional Diagrams: Solar System Orbits == | ||
| + | <table> | ||
| + | <tr> | ||
| + | <td> | ||
| + | [[Image:S2plot_orbits_sample.png]] | ||
| + | </td> | ||
| + | <td valign=top align=left width=80%> | ||
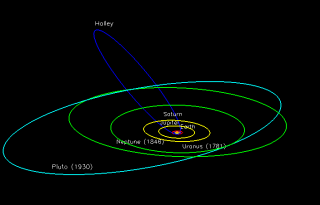
| + | S2PLOT can be used to create simple instructional diagrams, which are particularly useful when viewed interactively. In this case, the inclined, elliptical orbits of Pluto and Halley's Comet are seen with respect to the 8 planets of the Solar System. | ||
| + | </td> | ||
| + | </tr> | ||
| + | </table> | ||
| + | |||
| + | == Solar System Objects: Asteroid Kleopatra == | ||
| + | <table> | ||
| + | <tr> | ||
| + | <td> | ||
| + | [[Image:S2plot_kleopatra_sample.png]] | ||
| + | </td> | ||
| + | <td valign=top align=left width=80%> | ||
| + | Four views of the asteroid Kleopatra. | ||
| + | </td> | ||
| + | </tr> | ||
| + | </table> | ||
| + | |||
| + | == Creations: Abstract == | ||
| + | <table> | ||
| + | <tr> | ||
| + | <td> | ||
| + | [[Image:S2plot_psychedelic_sample.png]] | ||
| + | </td> | ||
| + | <td valign=top align=left width=80%> | ||
| + | A slightly more abstract view of a cosmological simulation - an homage to the power of S2PLOT! | ||
| + | </td> | ||
| + | </tr> | ||
| + | <tr> | ||
| + | <td> | ||
| + | [[Image:WelcomeImage.png]] | ||
| + | </td> | ||
| + | <td valign=top align=left width=80%> | ||
| + | Created for the WiggleZ project data server by Nick Jones (Swinburne). | ||
| + | </td> | ||
| + | </tr> | ||
| + | </table> | ||
| [[S2PLOT|Back]] to S2PLOT home page. | [[S2PLOT|Back]] to S2PLOT home page. | ||
Current revision
The following images were created using S2PLOT. All images are copyright Swinburne University of Technology unless otherwise indicated, and should not be used without permission.
Contents |
6dF Galaxy Survey
|
50,000 galaxies (v < 15,000 km/s) from the 6dF Galaxy Survey second data release (Jones et al. 2005). With S2PLOT, it is simple to create an interactive redshift-space cone diagram. |
Cosmological Simulation: Dark Matter Halo
|
In this example, the sub-halo structure in a Dark Matter halo is clearly visible. Along with coloured points for each particle, a real-time volume rendering helps to emphasise the regions of highest mass density. |
Cosmological Simulation: Merger Tree
|
A merger tree showing the assembly of a galaxy over time from the Millennium Run (Springel et al. 2005). Colour indicates the formation epochs of progenitor halos. |
Instructional Diagrams: Solar System Orbits
|
S2PLOT can be used to create simple instructional diagrams, which are particularly useful when viewed interactively. In this case, the inclined, elliptical orbits of Pluto and Halley's Comet are seen with respect to the 8 planets of the Solar System. |
Solar System Objects: Asteroid Kleopatra
|
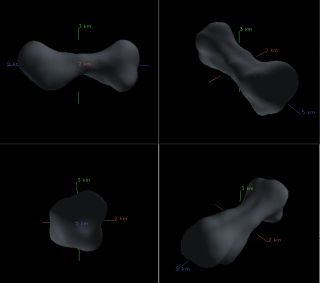
Four views of the asteroid Kleopatra. |
Creations: Abstract
|
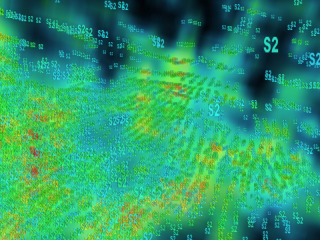
A slightly more abstract view of a cosmological simulation - an homage to the power of S2PLOT! |
|
|
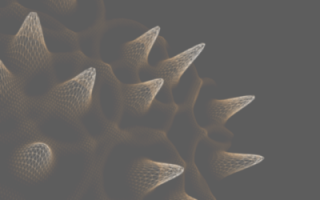
Created for the WiggleZ project data server by Nick Jones (Swinburne). |
Back to S2PLOT home page.
