S2PLOT:Gallery
From S2PLOT
(Difference between revisions)
| Revision as of 00:09, 20 December 2007 S2plot admin (Talk | contribs) ← Previous diff |
Revision as of 00:11, 20 December 2007 S2plot admin (Talk | contribs) Next diff → |
||
| Line 3: | Line 3: | ||
| == 6dF Galaxy Survey == | == 6dF Galaxy Survey == | ||
| [[Image:S2plot_6df_sample.png]] | [[Image:S2plot_6df_sample.png]] | ||
| + | |||
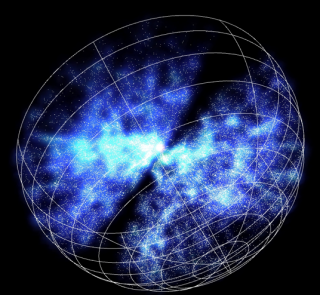
| 50,000 galaxies (v < 15,000 km/s) from the 6dF Galaxy Survey second data release (Jones et al. 2005). With S2PLOT, it is simple to create an interactive redshift-space cone diagram. | 50,000 galaxies (v < 15,000 km/s) from the 6dF Galaxy Survey second data release (Jones et al. 2005). With S2PLOT, it is simple to create an interactive redshift-space cone diagram. | ||
| [[S2PLOT|Back]] to S2PLOT home page. | [[S2PLOT|Back]] to S2PLOT home page. | ||
Revision as of 00:11, 20 December 2007
The following images were created using S2PLOT.
6dF Galaxy Survey
50,000 galaxies (v < 15,000 km/s) from the 6dF Galaxy Survey second data release (Jones et al. 2005). With S2PLOT, it is simple to create an interactive redshift-space cone diagram.
Back to S2PLOT home page.

