This page describes how to run your Solar System Dynamics simulations using the SAO web interface. We will explain how to use the web interface so you get familiar with it, but we won't discuss the steps you should follow to proceed with your investigations - that is what the project is all about!
The sections on this page are:
-
Logging on
Planet Setup Page
Simulation Parameter Setup Page
Job Status Page
Data Directories
Plotting Your Data
System Animations
Saving Your Data Locally
Troubleshooting
Logging on
To log on to the simulator, you need to go to the Planetary Dynamics Simulator page, which looks like this:
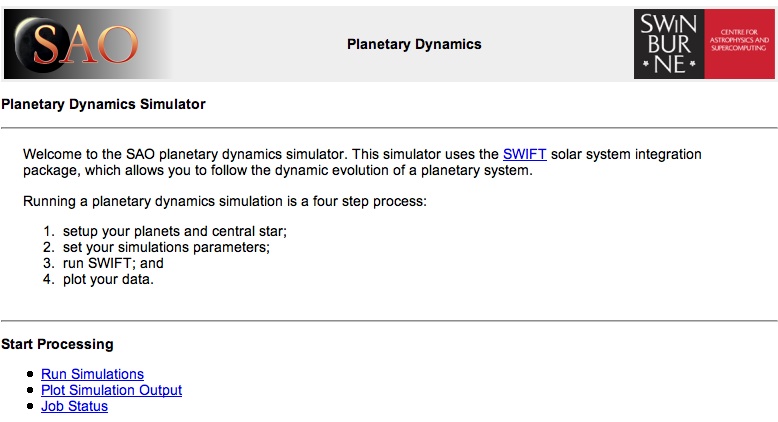
When you try to follow any of the links under the Start Processing title, you will be asked to enter you username and password (this was given out in Week 3). This will then log you in for the entire session (until you close your web browser).
At the bottom of each page in the simulator there is a common footer containing
links to all the important pages that make up the simulator:
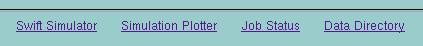
SWIFT is the name of the Solar System integration package that we use in this planetary dynamics project, so the Swift Simulator button will take you to the main simulator page (see below).
Now let's see the steps you should follow to run your simulations.
Planet Setup Page
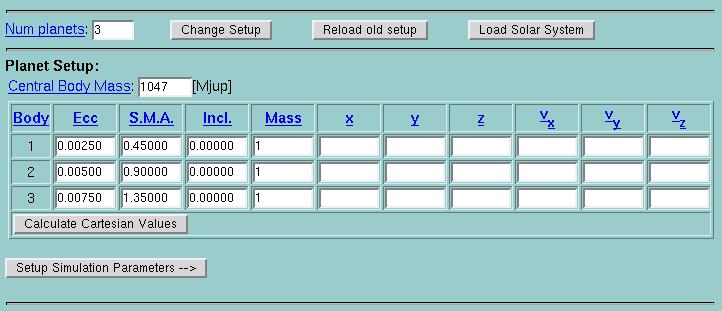
This is where you input the properties of the massive bodies in your planetary system. Your planetary system must consist of a single central massive object and up to 20 orbiting bodies. For example, you might create the Sun and the major planets of the Solar System, or alternatively the moon system around Jupiter. The Planet Setup Page looks like this:
You then need to follow these steps:
- First choose is the Number of planets. This does not include the central object in your system. Click the Change Setup button and the webpage will redraw the required number of input fields.
- Next choose the Central Body Mass.
- And then input the properties of each planet.
- You need to specify the Mass of each planet.
- You also need to describe the orbital parameters of each planet, by entering either the Keplerian (e, a, i), or the Cartesian (x, y, z, vx, vy, vz). If you just enter the Keplerian values (which is normally what you will do), you can view the equivalent Cartesian parameters by clicking Calculate Cartesian Values. The simulator will read the Cartesian parameters as its first preference, so if you enter information in all fields, the Keplerian orbital elements will be ignored.
Note that:
- For convince, we have included a button which loads the correct values for our Solar System.
- After you have run a simulation for a model, you can reload the last planetary system you have used clicking on the Reload old setup button. This button will only appear if you have already run a simulation.
- The maximum number of massive bodies (not including the central body) in the simulation is 20.
- The frame of reference is fixed on the central object, i.e. the central object is fixed at (0,0,0) and has no velocity.
- All parameters should be entered in units of Jupiter masses, AUs, degrees and years.
- If left blank, the Cartesian fields will automatically be filled in for you. The automatically calculated values will provide a stable orbit for the planet with a random initial position.
- You can enter your own values for the Cartesian fields if you want to create non stable orbits.
- If this is not the first simulation you have run for the current model, you have the option to restart the simulation that has just been completed (i.e. evolve the system for a longer time). If you would like to do this, click on the Reload old setup button that appears on the top of the page, and do not click the Calculate Cartesian Values button again (else new values of the planet's position & velocity will be calcualted). The simulator will complete the planet setup input fields automatically and you can just hit the Setup Simulation Parameters to continue.
Simulation Parameter Setup Page
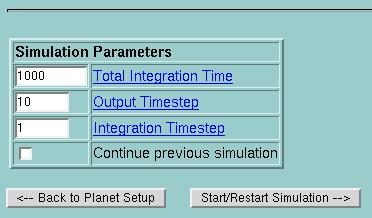
This section allows you to vary the parameters of your numerical integration (i.e., the part of the simulation code that actually works out the forces on all the planets at each moment in time).
For this section you need to:
- Choose the Total Integration Time.
- Enter the Integration Timestep, i.e. how much time elapses between each recalculation of the forces. Note that decreasing the time step will generally improve the accuracy of your results, but will greatly increase the running time of the simulation.
- Choose the data Output timestep. Reading out the position and velocity information for every planet is a time-consuming operation - you may choose to output data only once every 100 timesteps, for example.
- If the simulation is a restart, i.e. you are continuing the evolution of a system that you created in a previous simulation, check the Continue previous simulation box.
Note that:
- You need to think carefully about the complexity of your system and the required resolution of your results. A simulation with 20 planets that runs for several billion years using a small time step will take a very long (computational) time to evolve!
- Your final plots should not generally display more than ~200 data points for each body. Choose a combination of total integration time and data output time so that you achieve an appropriate plot resolution.
- All parameters should be entered in units of AUs and years.
- You must complete all fields.
Job Status Page
Once you hit the Start Simulation button, you will be taken to the Job Status page, which tells you the status of your job. This is the intermediate step as the webserver sends your job to the supercomputer and keeps the user (you) informed about the status of the job. This page looks like this:
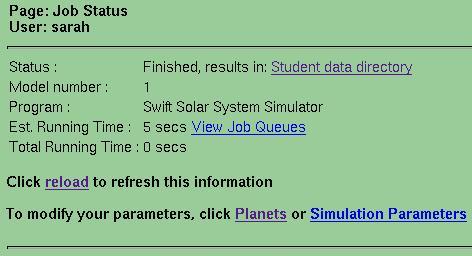
To get an update simply press reload. Once your job is ready, the Job Status page will have a link to the appropriate data directory and it will show "Status: Finished, results in Student Data Directory".
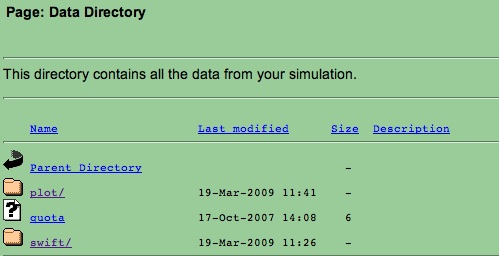
Data Directories
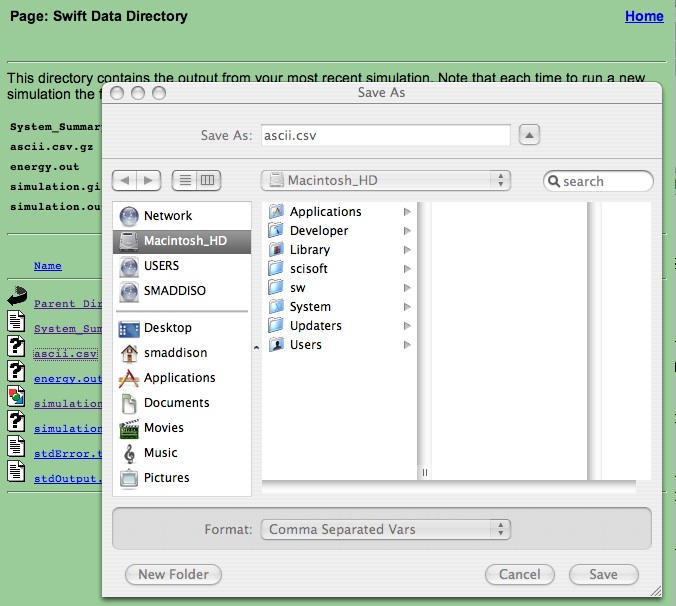
All you data is stored online in your student data directory. You can get to your data directory by either following the Student data directory link from the Job Status page, or follow the Data Directory link from the footer. This will take you to a page that looks like this:
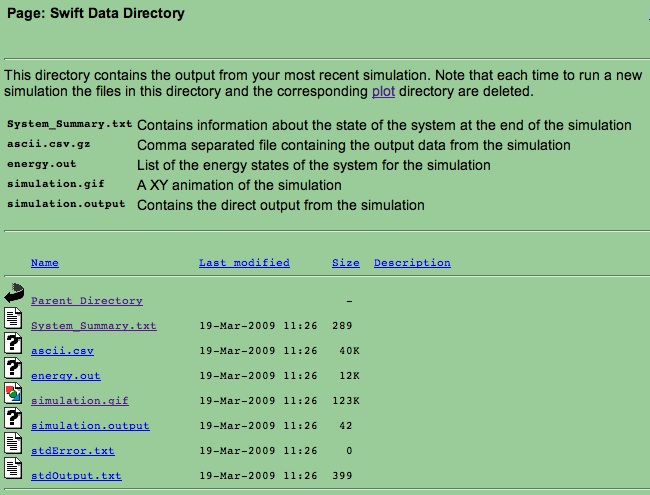
Your swift data directory contains all your simulation data and looks like this:
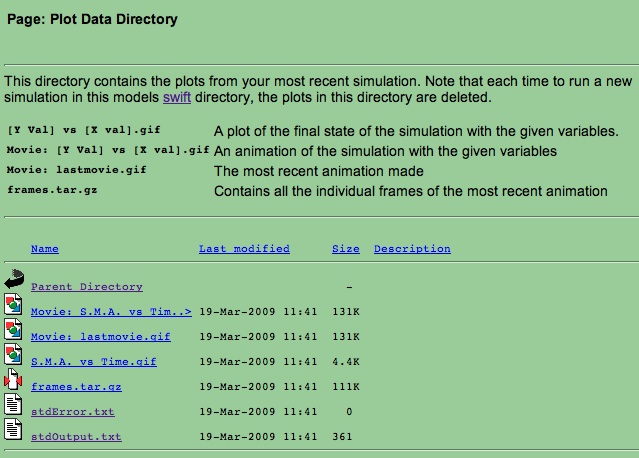
and your plot data directory contains all your plotting data (see next section) and looks like this:
Plotting Your Data Page
Once your simulation is complete, you will need to examine your results. The Simulation Plotter section allows you to plot each of the orbital parameters against either time or another orbital parameter and animations of your system's evolution. To plot your data, you need to:- Either go back to the Planetary Dynamics Simulator
homepage and click of the Plot Simulation Output
link, or follow the link on the page footer to Simulation
Plotter. This will take you to page that looks like this:
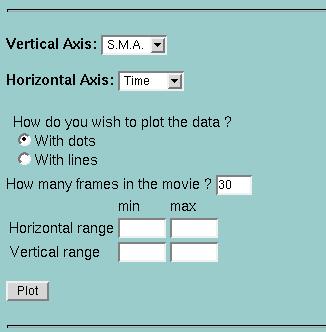
- Choose the parameter you want to plot on the x-axis from the Vertical Axis drop-down menu.
- Choose the parameter you want to plot on the y-axis from the Horizontal Axis drop-down menu.
- Choose whether you want to plot the data with dots or lines.
- Then click the Plot button. (Creating movies is described in the next section System Animations.)
- Don't forget that a text summary of what happened to all the planets in your system, system_summary.txt, is available in the swift subdirectory of your data directory. In the plot subdirectory, you can also download the plots you have generated.
System Animations
In addition to static plots of your data, the simulator allows you to produce movies (animated gifs) of your system's evolution. Every time you run a simulation, an animated gif showing the XY-view of your system will be automatically generated. To retrieve this movie:- Go to the Data Directory, then go to the swift subdirectory.
- Click on the filename simulation.gif.
You can also create movies showing the time evolution of the system's parameters. This is most useful when you don't plot time on either axis, but you would like to examine how the relationship between orbital parameters of your planets evolves. On the Simulation Plotter page:
- Choose the parameter you want to plot on the x-axis from the Horizontal Axis drop-down menu.
- Choose the parameter you want to plot on the y-axis from the Vertical Axis drop-down menu.
- Input the number of frames you would like in your movie.
- Click the Plot button.
- Download the movie you have created from the plot subdirectory, the file will be called (for example) Movie: SMA vs. Ecc.gif.
- Note that you can also inspect individual frames of your movie, i.e. examine the system at different stages of its evolution, by downloading the tarred and zipped file frames.tar.gz from the plot subdirectory.
Saving your data locally
The simulator allows you to create and store data of just one planetary simulation at one time. If you need to create more models or you want to compare data output from different simulations, you will need to save old planetary system data to your local machine.To do this, you need to:
- Click on the link to the Data Directory link.
- Save the files to your local machine by holding down the Shift key and
clicking on the file name you would like to download.
time[yr],planet no.,x[AU],y[AU],z[AU],a,e,inc[degrees]
time, N, x, y, z, a, e, i
time, N, x, y, z, a, e, i
time, N, x, y, z, a, e, i
If you experience problems running simulations, help may be available at the trouble shooting page. If not, you should email Sarah for help.
Good luck!
Back to....
Planetary Dynamics "Details" page
