Type Ia Supernova Light Curves
The light curve of a supernova is constructed by plotting its magnitude as a function of time. For Type Ia supernovae (SNIa), t = 0 corresponds to the time of maximum light in the B-band with negative numbers indicating the days before peak brightness.
They all have the same basic shape… To first order, the B-band light curves of all SNIa look the same. The initial very rapid increase in luminosity, where the brightness of the supernova can change by up to 3 magnitudes in 15 days, ends at maximum light. At this time the light curve turns over and begins a fairly rapid decline in brightness ( ~ 0.087 mag/day) for the next 3 – 4 weeks. By about a month after maximum light, the decline rate has changed again (to a steady ~ 0.015 mag/day) with the light curve now dominated by the radioactive decay of 56Co.
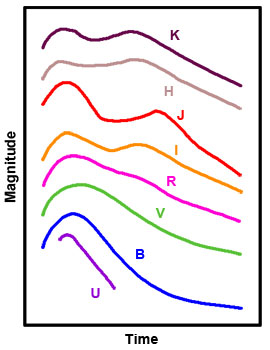
V-band light curves for SNIa look similar to those in the B-band, but as we move to redder and infra-red wavelengths we start to see a shoulder or even a secondary maximum appearing about 20 days after maximum light in most cases.
…but there are subtle differences Before dedicated supernova searches
and extensive follow-up photometry became the norm, the data for supernova light curves tended to start after maximum light and be patchy at best. In order to study the differences in SNIa light curves, higher quality data, particularly around maximum light was needed.
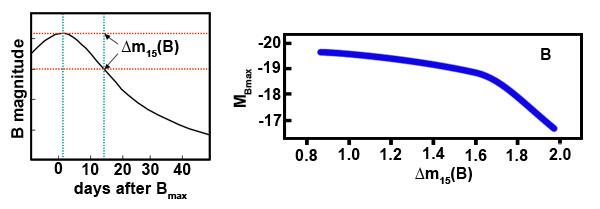
Now, with large amounts of high-quality optical data available, it is obvious that SNIa light curves show distinct variations. Perhaps the most important of these is the decline rate of the brightness after maximum light, a quantity which is correlated to the width of the maximum and the peak brightness of the supernova.
These quantities are linked in the sense that SNIa with fast decline rates are also fainter and have narrower light curve peaks. This is known as the luminosity-decline rate relation and was first demonstrated by Mark Phillips in 1993.

Obviously, if the peak brightness of a SNIa is linked to its decline rate, a quantity that varies from supernova to supernova, SNIa in optical light are not the standard candles originally imagined. They are, however, standardisable candles if we apply the luminosity-decline rate relation to our calculations. This is done via one of three light curve fitting techniques: the Δm15 method, the Multicoloured Light Curve Shapes method or the Stretch method. Each of these techniques uses a standard or series of standard light curves to determine how under or overluminous the new supernova is from a typical SNIa. Astronomers can then correct for the luminosity difference before using the supernova as a distance indicator.
By applying these techniques, SNIa make very precise distance indicators which can be observed over large distances. They have been instrumental in narrowing down the value of the Hubble Constant, and were the objects used to discover the accelerating universe.
Study Astronomy Online at Swinburne University
All material is © Swinburne University of Technology except where indicated.


