


| Part 3: |
A View from the Inside: The Galaxy:
In this Chapter, we discuss the properties of the Galaxy center, and finish with a selection of multiwavelength all-sky images of the Galaxy.
The Galaxy is an Sbc/SBbc spiral galaxy and in the atlas it is classified
in the Normal (N) category of our sample, yet additional
categories Interacting (I), and Active? (A?) (see Table 1) are also assigned. The Galaxy
(along with the LMC and SMC) is classified I due to the existence of the H I
Magellanic Stream (Wannier and Wrixon 1972; Murai and Fujimoto 1986) as shown in Figure 1.22.
An A? classification is also given because the optical
spectrum integrated over the central parsec of the Galaxy resembles a
Seyfert galaxy (Mezger et al. 1996). This is consistent with results
that suggest the presence of a several million M black hole in the nucleus.
Quiet Monster - Sagittarius A*:
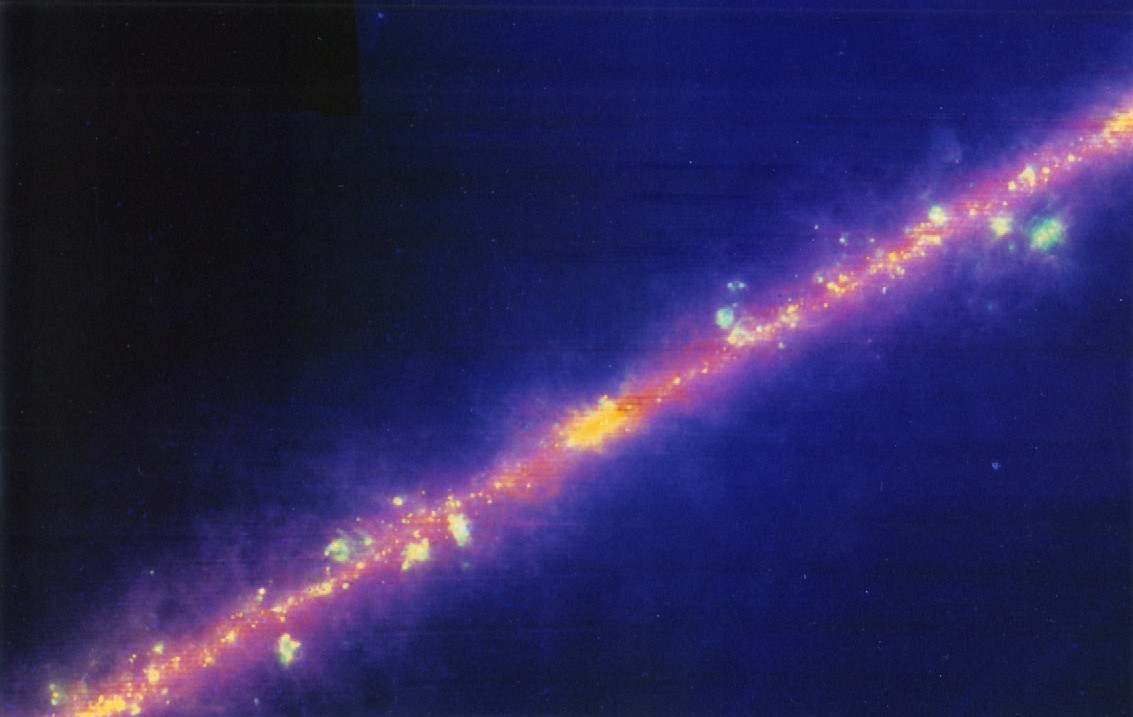
Figure 3.1: The disk of the Galaxy. The IRAS infrared image shows the central 48° by 33° region of the Galaxy. The warmest dust is shown in blue whilst the coldest is represented by red. The regions of yellow are giant clouds of interstellar gas and dust. Credit: Infrared Processing and Analysis Center, Caltech/JPL.
Our Galaxy's nucleus, some 8.5 kpc distant in the constellation of Sagittarius, has long been a target for multiwavelength observations. Because of the large amounts of obscuring dust towards the nucleus and in the disk of the Galaxy, infrared observations have proved invaluable in showing the content and structure of this region. Figure 3.1 shows a 48° by 33° IRAS IR image of the central region of the Galaxy. The disk of the Galaxy is the bright band running diagonally across the image.
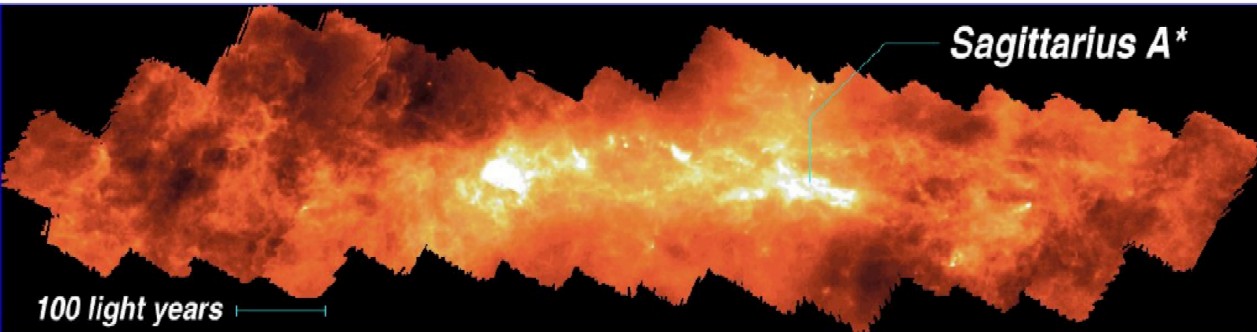
Figure 3.2: The Galaxy Center. A JCMT SCUBA image at 850 µm spanning 1450 light-years (~440 pc). The position of Sgr A* is indicated. The image spans 2.9° in Galactic longitude, and 0.8° in Galactic latitude, Credit: D. Pierce-Price, U. of Cambridge.
The bright central region contains the nucleus. The concentrated blobs of yellow are giant clouds of interstellar gas and dust heated by recently formed stars and nearby massive, hot stars. The Galactic center harbors a strong radio continuum source, known as Sagittarius A or Sgr A, containing a bright source (Sgr A West) within which there is a smaller, concentrated source called Sagittarius A* or Sgr A* (pronounced Sadge-A-star). The central part of the Galaxy has also been imaged at submillimeter wavelengths. A slice across the Galactic plane measuring 1450 light-years (~440 pc) is shown in Figure 3.2. This image is a mosaic of many smaller images taken over 15 nights (and spanning two years) using SCUBA at JCMT. The image shows emission at 850 µm and identifies the distribution of cold interstellar dust that resides in molecular clouds of gas. ...
[...]
All-sky maps of the Galaxy:
Our Solar System, is ~8.5 kpc from the Galaxy nucleus, and is located in the Orion or Local Arm. The Galaxy is viewed from well inside its disk, which is 800 - 1000 pc thick at the location of the Sun. Each of the following images presents the whole sky in Galactic coordinates, with the plane of the Galaxy extending along the horizontal axis, and the nucleus of the Galaxy at the center. Each image (apart from Figure 3.9) is shown in Aithoff projection.
Galactic longitude (l) runs from 0° at the center to 180° at the left edge, and from 180° to 360° from right edge back to the center. The north and south Galactic poles (latitudes b = +,- 90°) are at the top and bottom respectively of each image.
[...]
Optical - H at 6563Å:
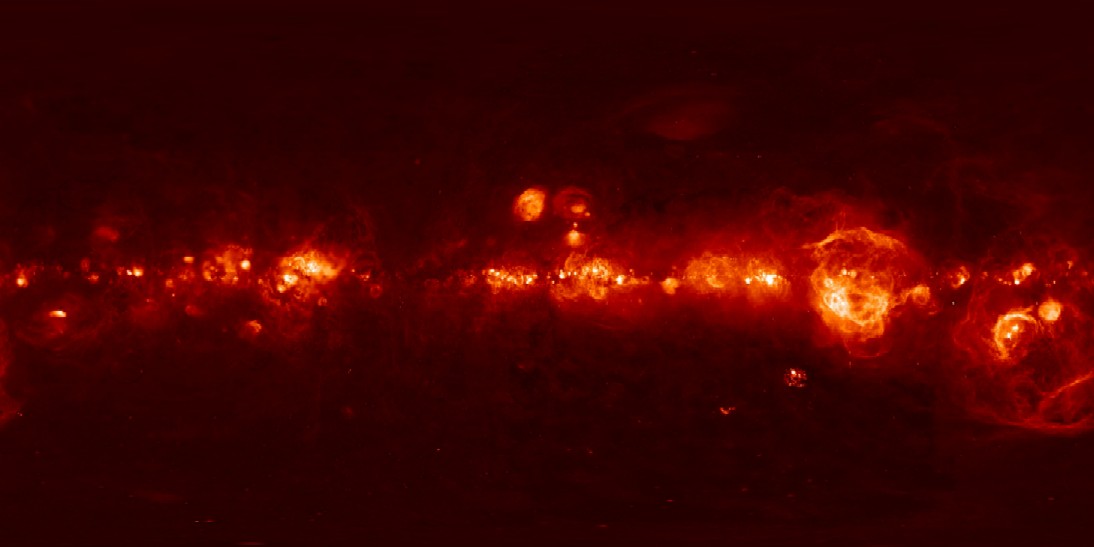
Figure 3.9: The Galaxy: Optical - H
at 6563Å Credit: Permission granted
by D. Finkbeiner. Original data from WHAM (funded primarily through the National
Science Foundation, NSF), VTSS and SHASSA (both supported by the NSF).
The SHASSA data is copyright © Las Cumbres Observatory, Inc.
Figure 3.9 shows optical line emission from H
(6563Å), ionized hydrogen gas.
The image2 has 6' (FWHM) resolution and is a composite of
the Virginia Tech Spectral line Survey (VTSS) in the northern hemisphere and the
Southern H-Alpha Sky Survey Atlas (SHASSA) in the southern hemisphere.
The Wisconsin H-Alpha Mapper (WHAM) survey is used to calibrate the data.
VTSS used the Virginia Tech Spectral Line Imaging Camera (SLIC) at
Martin Observatory in southwestern Virginia.
SHASSA observations were taken with a robotic camera at CTIO in Chile.
WHAM used a 0.6 m telescope at KPNO in Arizona for two years from 1996.
The surveys allow a study of the structure and kinematics of the
warm ionized interstellar medium (WIM), a hydrogen gas plasma at
104 K. These images show 'supershells' and 'chimney' structures
and allow a comparison with other phases of the ISM
such as atomic hydrogen, HI (e.g. Reynolds et al. 1995).
1Aithoff projection preserves the presentation of equal areas as would be seen on the surface of a sphere.
2Not in Aithoff projection - emission is plotted across the whole field-of-view.