Gamma Ray Burst Light Curves
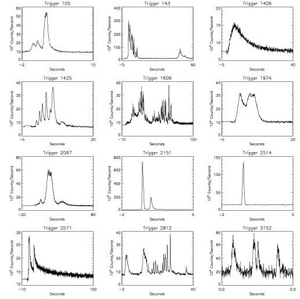
The light curves of gamma ray bursts (GRBs) plot the number of gamma rays detected against time. They reveal that GRBs can be as short as several milliseconds or as long as several minutes, with variability seen on millisecond timescales. In order to produce such rapid variations, the energy of the GRB must be emitted from a very small region, as objects cannot vary faster than the time it takes for electromagnetic radiation to travel across them. This rapid variability therefore places strong constraints on possible progenitor scenarios and energy formation mechanisms for GRBs.
GRB light curves are quite varied in shape, ranging from smooth single pulses, to multiple peaks well separated in time, to others which are highly erratic. About 25-30% of all GRB light curves are simple and contain only one pulse, while the more complex curves are generally made up of several overlapping pulses.
Study Astronomy Online at Swinburne University
All material is © Swinburne University of Technology except where indicated.


