 |
|
Office:
AR 315
Calendar |
|
Home
The mean ultraviolet spectrum of type Ia supernovae using the Hubble Space Telescope
Type Ia supernovae are believed to be the deaths of
white dwarf stars
which are the remnant cores of low-mass stars (like our Sun) after they have
died. A type Ia supernova may occur either when a white dwarf star accretes
matter from a very nearby giant star that is in the process of bloating and
expanding its outer envelope of gas or when two white dwarf stars are in a
close orbit and eventually merge together (see the figures to the right).
When transforming the
light curves
of type Ia supernovae using observed relationships, these events become excellent
distance indicators and, because of their extreme brilliance, are effective out to
great distances. Type Ia supernovae have been used to show that the expansion rate
of the universe is accelerating, uncovering the existence of dark energy. This work
earned type Ia supernova researchers Brian Schmidt, Saul Permutter, and Adam Riess the
2011 Nobel Prize in physics.
Very deep observations are necessary to explore the early universe and examine the
conditions during the first half of cosmic time. To reach the faintest supernovae
(and, hence the farthest), astronomers use sensitive optical detectors on large
telescopes. Because of
cosmological redshift,
high redshift optical observations sample restframe ultraviolet (UV). Recent work
has found a dispersion in the UV that could have a important impact on future surveys
and the utility of type Ia to accurately probe the expansion rate of the early Universe.
Our team undertook a large project to measure the mean type Ia supernova
UV spectrum and search for any dispersion. This project is quite difficult because
the UV can only be observed from space. For this program, we used the
STIS spectrograph on the
Hubble Space Telescope.
To catch the short-lived supernovae near their peak brightness and send off
identified type Ia events to the Hubble Space Telescope to be observed 10-12 days
later, we had to scour the skies and search hundreds of thousands of galaxies in
hopes of finding a few faint, initial outbursts of supernovae as they were just
beginning to brighten with time (7-16 days before peak brightness).
In addition, we had to "take over" many of the world's largest telescopes the next
night (or soon thereafter) to confirm their identifications. An illustration of the
timeline of the program to achieve these results is shown in Figure 1 below.
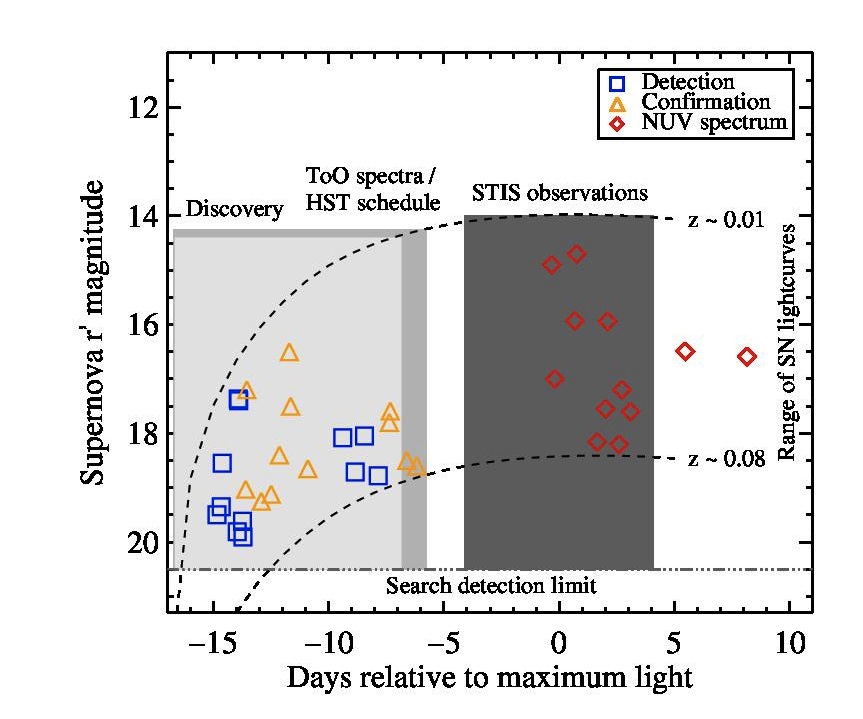
Figure 1: Large areas of the sky containing hundreds of thousands of galaxies were
monitored night after night by the
Palomar Transient Factory
in an effort to detect early type Ia supernovae. The blue squares show the days before
peak brightness and the observed magnitude of the supernovae found by the Palomar
Transient Factory. The gold triangles are the ages and magnitudes of the supernovae
when we (rapidly) observed them using large telescopes all over the world to confirm
their identity. Finally, the red diamonds indicate the ages and magnitudes of the
supernovae when they were observed by the Hubble Space Telescope.
The dashed curves indicate the distances of the supernovae in redshift (z) and their
approximate brightness evolution with time.
This project could not have been done without the hard work and intelligent processing of
an enormous amount of data by the
Palomar Transient Factory Team. Remarkably, the team was able to detect type Ia
supernovae as early as 15 days before they reached their maximum brightness (~3-4
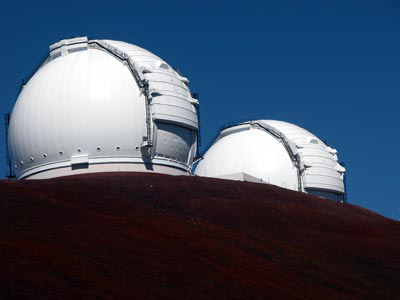
days after explosion). After the supernovae were discovered, we utilzed telescopes
such as the Palomar 5m,
VLT 8m,
William Herschel Telescope,
Gemini 8m, and
Keck 10m, to spectroscopically confirm and
phase the events. The UV spectra taken by
Hubble Space Telescope are shown in Figure 2 below.
Our team reported the mean near UV spectrum and dispersion of type Ia SNe in
Cooke et al. (2011)
which was constructed from the individual spectra shown below.
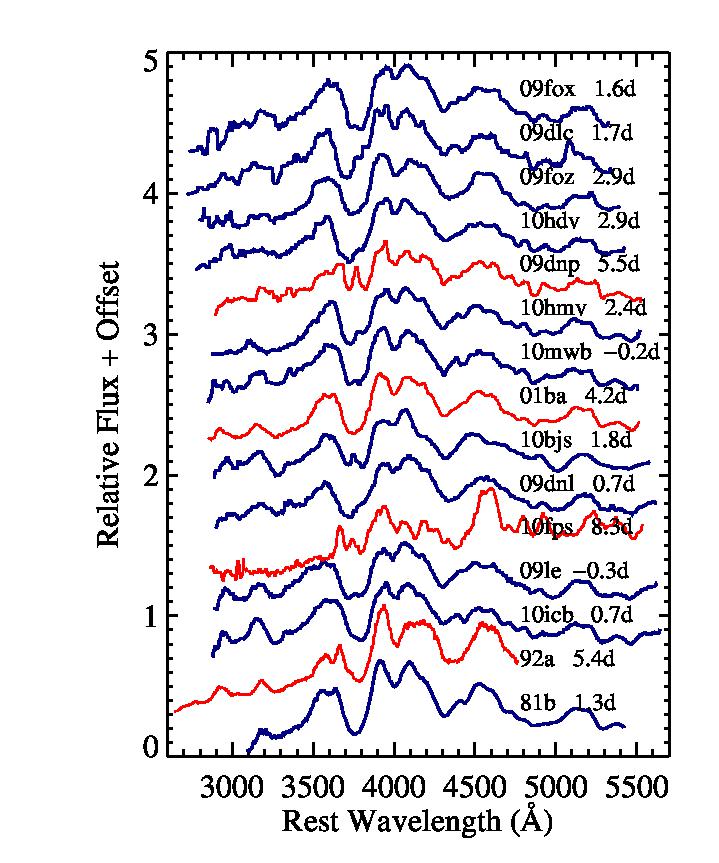
Figure 2: The spectra of 15 type Ia supernovae taken by the
STIS spectrograph on the
Hubble Space Telescope. The blue spectra were
the supernovae caught quick enough to be combined and compared to spectra of supernovae
at higher redshift. Each spectrum is squashed in the vertical direction here in order
to fit them all on the plot.
Click here to access the ADS link displaying a list of
articles describing this work and other research of mine.
|
|
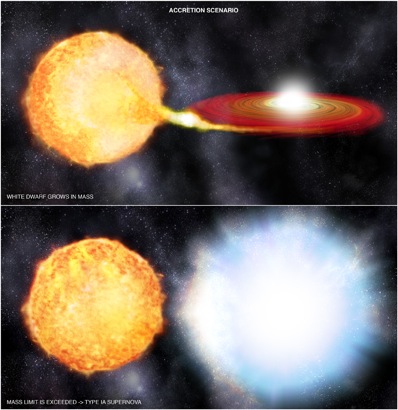
White dwarf star in close orbit with a giant star. The white dwarf steals
matter from the evolving giant star as it slowly expands.
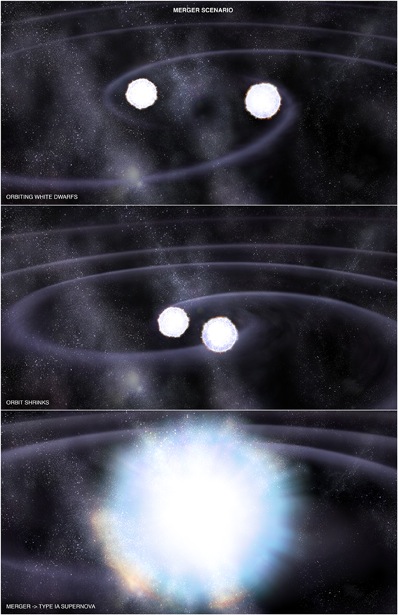
Two white dwarf stars in a close orbit. These
two stars spiral inward and merge.
(Image credits: NASA/CXC/M. Weiss)
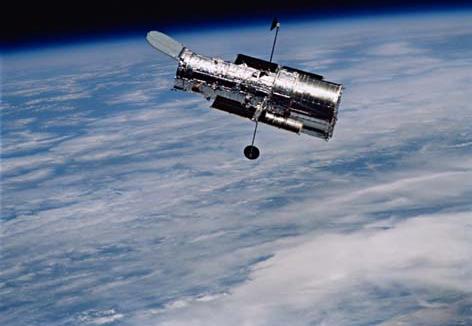
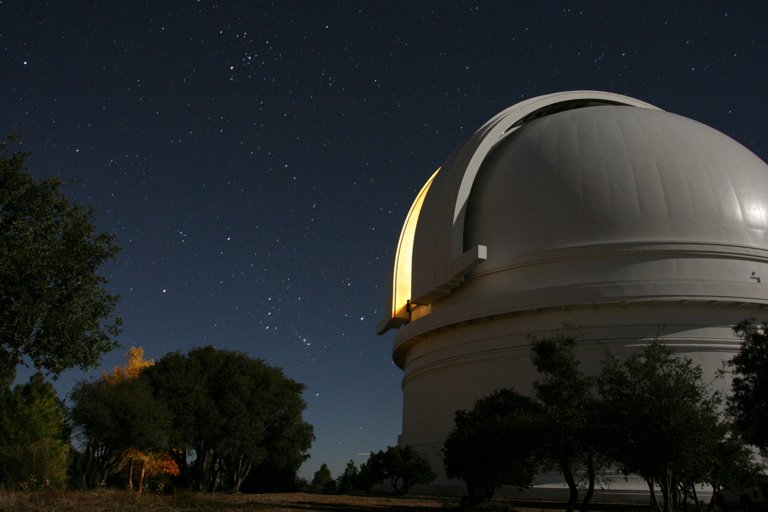
The Hubble Space Telescope
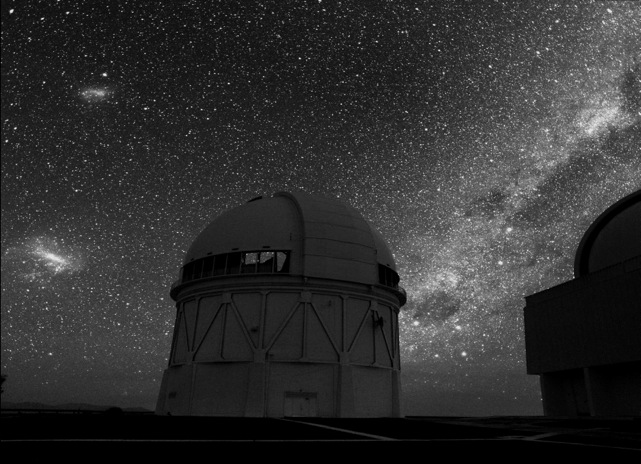
| The Milky Way can be seen, as well as two
of our closest companion galaxies, the Large and Small
Magellenic Clouds, in this long-exposure image of the 4
meter telescope at
the CTIO
located in the Southern Hemisphere (Chile). |
 |
|