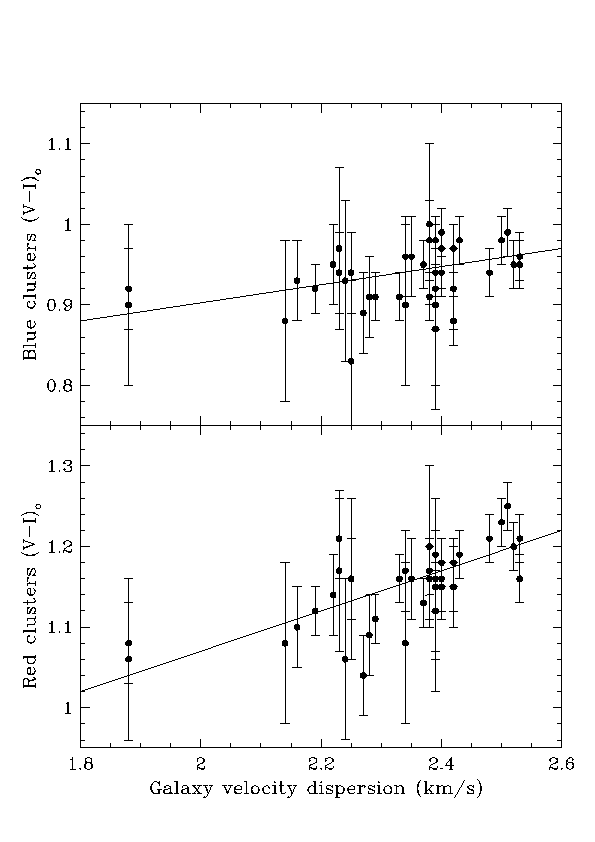
Figure 1 : Plot of populations of Blue and Red
Globular Clusters for 40 galaxies

Figure 1 : Plot of populations of Blue and Red
Globular Clusters for 40 galaxies

Statistical tests
Least squares weighted best fit y = c1 * x + c2
Spearman Rank test was used to test probability of correlation
|
|
|
|
||||||
|
|
|
|
|
|
|
|
|
|
|
Blue/Red GC vs. Velocity Dispersion |
(4.5 sigma) |
|
|
|
(2.0 sigma) |
|
|
|