| |  |
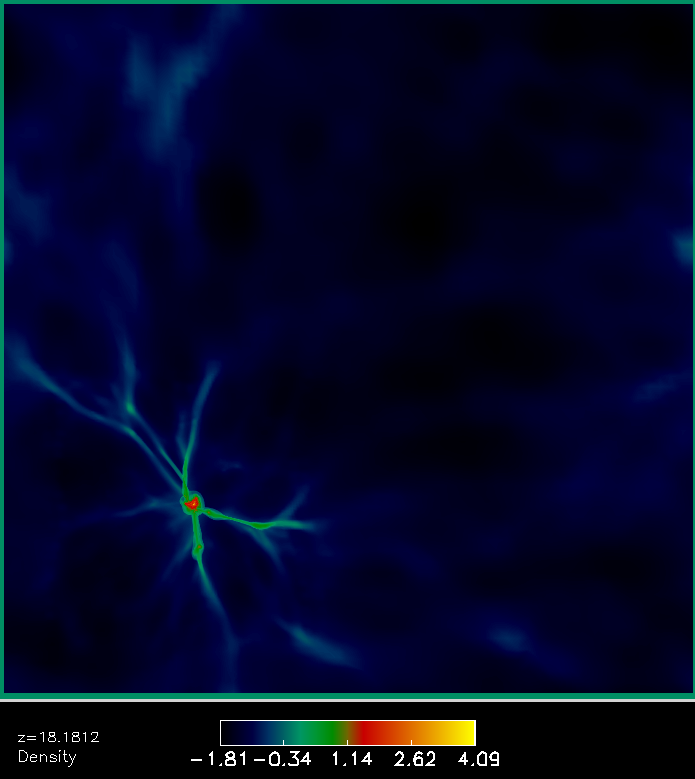
Below you see a number of thin slices through the three dimensional volume depicting the logarithm of the gas density. Please note that the colormap changes in order to visualize the 16 orders of magnitude covered in densities. The simulation visualized here and in the temperature section has "only" a dynamic range of 1010.
Clicking on the images shows you the corresponding temperature slice.
